Machine Learning Powered Naughty List: A Festive Jumping Rivers Story
Introduction
Ho ho ho! 🎅 The holiday season is here, and at Jumping Rivers, we’re decking the halls with data, not just tinsel. While elves are busy checking their lists twice, we thought: why not bring a little machine learning magic to Christmas? After all, what’s more festive than combining predictive modeling with candy canes, cookies, and a sprinkle of office mischief?
This blog is your all-access pass to a code-powered journey where we find out who’s been naughty, who’s nice, and who’s just mischievously hovering in between.
We’ll walk you through the process step by step: gathering the team data, inventing the most festive features, training our ML model, and revealing the results with a cheeky, holiday twist. So grab a mug of cocoa, put on your favorite Christmas socks, and let’s dive into the Jumping Rivers ML-Powered Naughty List adventure!
Note: All data, labels, and results in this post are entirely fictional and randomly generated for festive fun.
Step 1: Data Collection and Team Introduction
Our first step was gathering our dataset. We used the Jumping Rivers team as the participants, assigning playful, holiday-themed features to reflect their potential ‘naughty’ traits. Here’s a concise, festive overview in a side-by-side table format:
Each participant is assigned four playful features that represent holiday mischief:
- Ate too many cookies 🍪
- Forgot to send Christmas cards 💌
- Sang off-key during carols 🎶
- Gift wrapping disasters 🎁
Every name on this list is now in the running for the ultimate festive title: Naughty, Nice, or Mildly Mischievous. Rumor has it that Santa’s Intern Elf already claimed the top spot for cookie mischief, while Rudolph keeps dashboards squeaky clean, and Frosty the Snow Analyst is maintaining a perfectly balanced winter score.
Step 2: Feature Engineering
For ML purposes, names were encoded numerically. This is not meaningful in a real-world ML context but serves as a demonstration of preprocessing. The features for modeling include:
- Name (encoded)
- Ate too many cookies
- Forgot to send Christmas cards
- Sang off-key
- Gift wrapping disasters
Step 3: Model Training
We chose a Random Forest classifier in R for its simplicity and interpretability. The model was trained on the dataset to predict the ‘naughty’ label based on the four behavioral features and the encoded name. Although the dataset is small and playful, this demonstrates a proper ML workflow: data collection, preprocessing, model training, prediction.
library(tidyverse)
library(randomForest)
library(ggplot2)
The first thing we need to do is set up a vector containing the team members along with some Christmas temp workers Santa’s Intern Elf, Rudolph the Data Reindeer and Frosty the Snow Analyst.
# Team members
team = c(
  "Esther Gillespie",
  "Colin Gillespie",
  "Sebastian Mellor",
  "Martin Smith",
  "Richard Brown",
  "Shane Halloran",
  "Mitchell Oliver",
  "Keith Newman",
  "Russ Hyde",
  "Gigi Kenneth",
  "Pedro Silva",
  "Carolyn Wilson",
  "Myles Mitchell",
  "Theo Roe",
  "Tim Brock",
  "Osheen MacOscar",
  "Emily Wales",
  "Amieroh Abrahams",
  "Deborah Washington",
  "Susan Smith",
  "Santa's Intern Elf",
  "Rudolph the Data Reindeer",
  "Frosty the Snow Analyst"
)
Now we have the team members we will randomly generate some values for the model features.
# Randomly generate playful 'naughty traits'
set.seed(51)
df = tibble(
  name = team,
  ate_too_many_cookies = sample(0:1, length(team), replace = TRUE),
  forgot_to_send_cards = sample(0:1, length(team), replace = TRUE),
  sang_off_key = sample(0:1, length(team), replace = TRUE),
  wrapping_disaster = sample(0:1, length(team), replace = TRUE),
  naughty = sample(0:1, length(team), replace = TRUE)
)


# Encode names as numeric
df$name_encoded = as.numeric(factor(df$name))
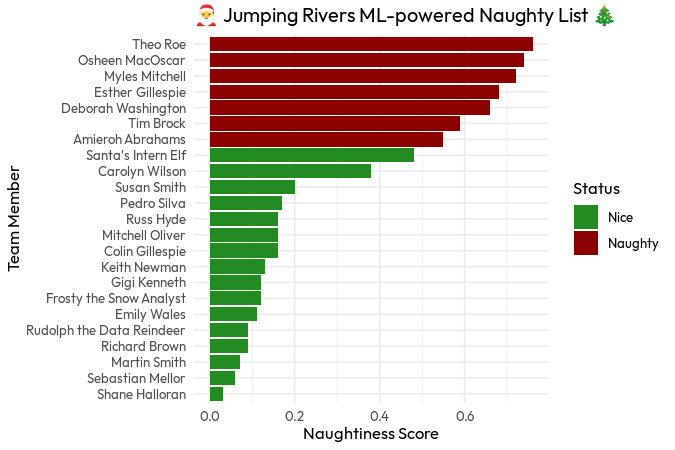
Next on the list is to set up a vector of features we want to use, and then train the model. We can then use the model to predict our fictitious naughtiness score for each team member! We can see Theo is at the top of the list, closely followed by Osheen.
features = c(
  "name_encoded",
  "ate_too_many_cookies",
  "forgot_to_send_cards",
  "sang_off_key",
  "wrapping_disaster"
)


# Train Random Forest
rf_model = randomForest(x = df[, features],
                        y = as.factor(df$naughty),
                        ntree = 100)


# Predict naughtiness
df$predicted_naughty = predict(rf_model, df[, features])
df$naughtiness_score = predict(rf_model, df[, features],
                                type = "prob")[, 2]


# Create the Naughty List
naughty_list = df %>%
  arrange(desc(naughtiness_score)) %>%
  select(name, naughtiness_score, predicted_naughty)

print(naughty_list)
## # A tibble: 23 × 3
##    name               naughtiness_score predicted_naughty
##    <chr>                          <dbl> <fct>
##  1 Theo Roe                        0.76 1
##  2 Osheen MacOscar                 0.74 1
##  3 Myles Mitchell                  0.72 1
##  4 Esther Gillespie                0.68 1
##  5 Deborah Washington              0.66 1
##  6 Tim Brock                       0.59 1
##  7 Amieroh Abrahams                0.55 1
##  8 Santa's Intern Elf              0.48 0
##  9 Carolyn Wilson                  0.38 0
## 10 Susan Smith                     0.2  0
## # ℹ 13 more rows
The last thing to do is visualise our results with {ggplot2}:
# Fun bar plot
ggplot(naughty_list,
       aes(x = reorder(name, naughtiness_score),
           y = naughtiness_score,
           fill = as.factor(predicted_naughty))) +
  geom_col() +
  coord_flip() +
  scale_fill_manual(values = c("0" = "forestgreen",
                               "1" = "darkred"),
                    labels = c("Nice", "Naughty")) +
  labs(title = "🎅 Jumping Rivers ML-powered Naughty List 🎄",
       x = "Team Member",
       y = "Naughtiness Score",
       fill = "Status",
       alt = "Jumping Rivers Naughty List") +
  theme_minimal(base_family = "outfit")

Step 4: Analysis and Notes
After generating predictions, we can interpret the Naughty List. The highest naughtiness scores indicate which participants are most mischievous according to our playful model.
Observations from this analysis include:
- Cookie Enthusiasts: Participants with multiple cookie infractions scored higher.
- Gift Wrapping Chaos: Those whose presents looked like abstract art contributed to higher scores.
- Musical Mishaps: Off-key carolers were highlighted as naughty.
- Forgotten Cards: Small lapses in festive correspondence nudged some up the naughty rankings.
Special mentions:
- Theo unsurprisingly tops the naughty list.
- Santa’s Intern Elf performed well, staying mostly nice.
- Shane had the best score and I’m sure Santa will be very nice to him this year!
This analysis provides both a technical demonstration of ML workflow and a fun story that engages readers during the festive season.
Step 5: Conclusion
This project demonstrates how machine learning can be used in creative ways outside of traditional business use cases. By combining features with a proper ML workflow, we created a light-hearted, festive story suitable for a blog, while also reinforcing good practices in data collection, preprocessing, modeling, and visualization.
Ultimately, the Jumping Rivers ML-Powered Naughty List is a celebration of data science, team culture, and holiday fun. Whether you’re naughty or nice, we hope this inspires creative applications of ML in festive contexts.