How to create a clickable world cloud with wordcloud2 and Shiny
Word clouds are a visual representation of text data where words are arranged in a cluster, with the size of each word reflecting its frequency or importance in the data set. Word clouds are a great way of displaying the most prominent topics or keywords in free text data obtained from websites, social media feeds, reviews, articles and more. If you want to learn more about working with unstructured text data, we recommend attending our Text Mining in R course
Usually, a word cloud will be used solely as an output. But what if you wanted to use a word cloud as an input? For example, let’s say we visualised the most common words in reviews for a hotel. Imagine we could then click on a specific word in the word cloud, and it would then show us only the reviews which mention that specific word. Useful, right?
This blog will take you through creating a clickable word cloud in a Shiny app, where the user can click any word in the word cloud to filter an output table. We will be using the 2021 TidyTuesday Netflix titles data set and the {wordcloud2} package to create our word cloud. We will then integrate it in a Shiny app with a reactively filtered {DT} table output.
Creating a word cloud with {wordcloud2}
{wordcloud2} is an R package which creates HTML-based word clouds, based
on wordcloud2.js. The main
function is simply called wordcloud2() and takes a word count data
frame as an input i.e. one column containing the words, one column
containing the frequencies of those words.
Before creating the word cloud, we need to read in our data using the {tidytuesdayR} package. If you want to see the full source code for the final Shiny app, check out our GitHub.
tuesdata = tidytuesdayR::tt_load("2021-04-20")
netflix_titles = tuesdata$netflix_titles
To create our word count data frame, we will use a combination of {dplyr} and {tidytext} functions. We filter out words that are used in 10 titles or less to prevent our word cloud from being too crowded.
library("dplyr")
library("tidytext")

word_counts = netflix_titles %>%
  unnest_tokens("word", title) %>%
  anti_join(stop_words, by = "word") %>%
  count(word) %>%
  filter(n > 10)
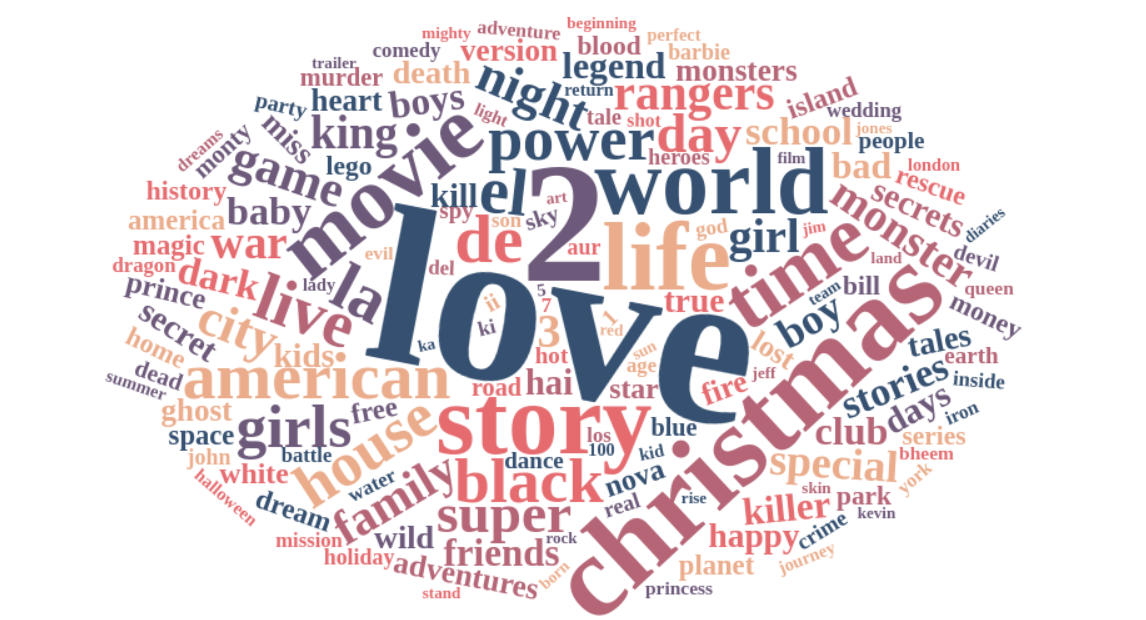
word_counts %>%
  arrange(desc(n))
## # A tibble: 157 × 2
##    word          n
##    <chr>     <int>
##  1 love        151
##  2 2           115
##  3 christmas    78
##  4 story        67
##  5 life         65
##  6 world        63
##  7 movie        60
##  8 time         54
##  9 de           46
## 10 american     45
## # ℹ 147 more rows
Then we just need to pass this word count data frame into the
wordcloud2() function. We’re using a custom colour palette instead of
the default one. wordcloud2() requires a colour palette vector of the
same length as the data set, so you can use the rep_len() function to
achieve this.
library("wordcloud2")
my_palette = c("#355070",
"#6d597a",
"#b56576",
"#e56b6f",
"#eaac8b")
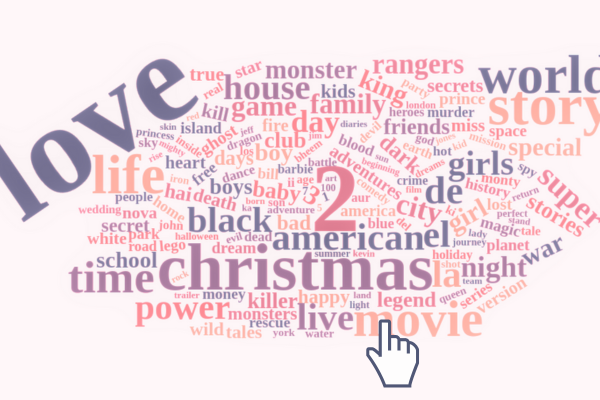
my_wordcloud = wordcloud2(
word_counts,
color = rep_len(my_palette,
nrow(word_counts)))
The wordcloud2 package contains two functions for incorporating word
clouds in a Shiny app: wordcloud2Output() and renderWordcloud2().
These work in the same way as most *Output() and render*()
functions.
library("shiny")
ui = fluidPage(
  wordcloud2Output("wordcloud")
)

server = function(input, output) {
  output$wordcloud = renderWordcloud2(my_wordcloud)
}

shinyApp(ui, server)
Binding a JavaScript click event to a Shiny input
Now to the key part of this blog post. We want to be able to click on a
word in the word cloud, and use the clicked word as an input in Shiny.
We need to write some JavaScript for this, which will be wrapped in the
HTML() function within a script tag (tags$script()). We are
writing an anonymous function, i.e. an unnamed function, which will be
run whenever we click on a word in the word cloud. The function will
extract the text content of the label produced when we hover over a
word, and then cast this to a Shiny input called clicked_word.
ui = fluidPage(
  tags$script(HTML(
    "$(document).on('click', '#canvas', function() {
      word = $('#wcLabel').text();
      Shiny.onInputChange('clicked_word', word);
    });")),
  wordcloud2Output("wordcloud")
)
Now, we can use input$clicked_word in our Shiny server to filter the
Netflix titles to retain only the titles which contain that specific
word. We use a combination of {dplyr} and
{stringr} to do this. The input also
contains the count, e.g. “love: 151”, so we need to first use a regular
expression remove the colon and any numbers after it.
server = function(input, output) {
  output$wordcloud = renderWordcloud2(my_wordcloud)

  filtered_netflix = reactive({
    clicked_word = str_remove(input$clicked_word, ":[0-9]+$")

    netflix_titles %>%
      filter(str_detect(tolower(title), clicked_word)) %>%
      select(title, everything(), -show_id)
  })
}
The final step is to create an output table of the filtered data. We use
the renderDT() and DTOutput() functions from {DT} to do this, but
you can use any package for creating tables.
library("DT")

ui = fluidPage(
  <...>,
  DTOutput("filtered_tbl")
)

server =  function(input, output) {
  <...>,
  output$filtered_tbl = renderDT(filtered_netflix())
}
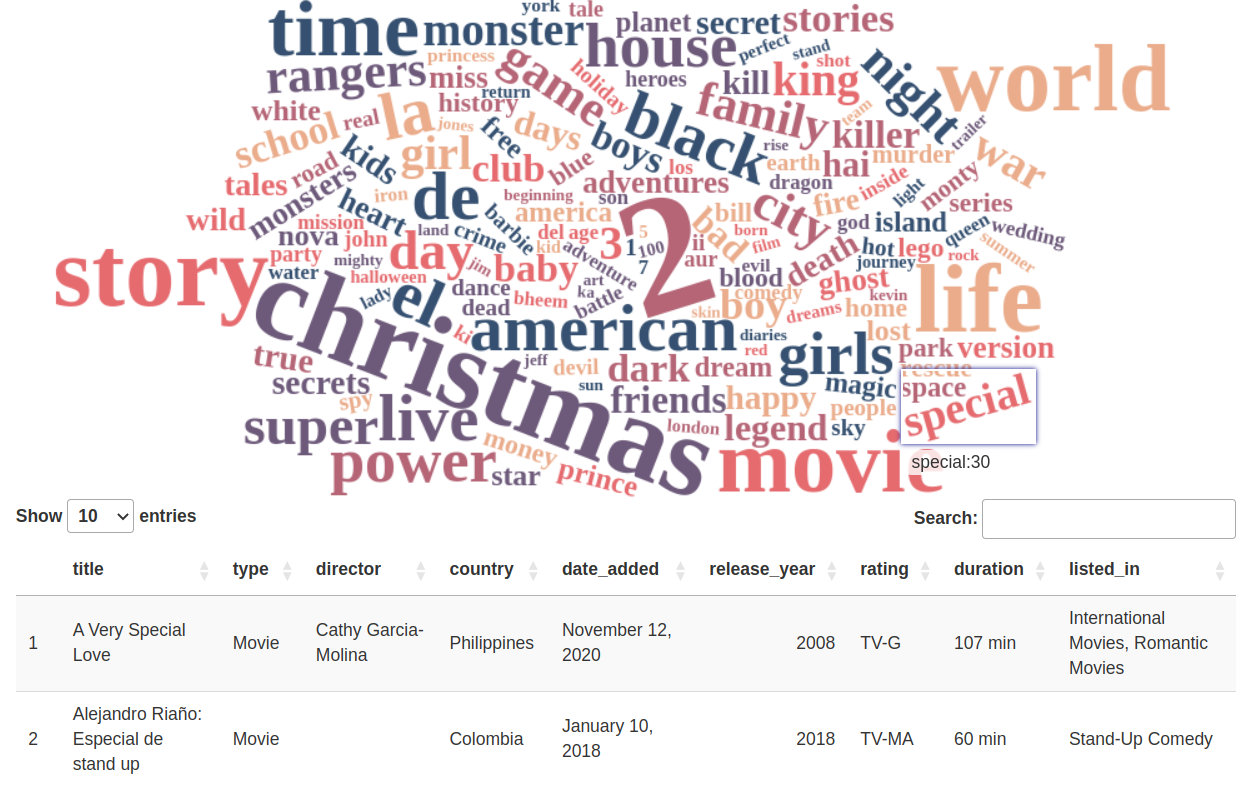
Now, you should have an interactive word cloud input which allows you to filter a table based on whichever word you click! You can of course use the word input for something else, for example, you could re-render the word cloud every time you click a word to show you the words which are most often used together with your clicked word, or you could use the input to create some further visualisations.
If you’re interested in learning more about Shiny, check out our Shiny in Production conference, taking place October 12th-13th in Newcastle upon Tyne. We’ll be focussing on all things shiny as well as other web-based R packages, with an afternoon of workshops run by our JR trainers, followed by a day of talks from R experts!