
Dashboard Health Check
- Code structure
- Continuous Integration and continuous deployment
- Accessibility
- Server and webpage security
- Documentation
- Testing and validation
- Application Performance
As analytical output becomes more prevalent, its relevance and usability for non-analytical business people become even more critical. After all, delivering better decision-making information is the crucial reason for analytics in the first place.
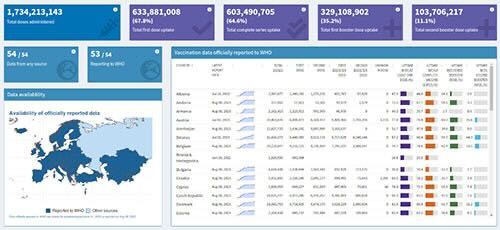
Our team can help you utilise visualisation techniques to create maximum impact and understanding, developing interactive dashboards, reports and web applications that are automated and accessible to those without any analytics or programming knowledge.
We specialise in creating dashboards, reports and web applications using a variety of tools and techniques. Alongside R and Python specialists, our team includes experts in server-side technologies like Azure and AWS as well as client-side JavaScript APIs and visualisation libraries like d3.js. All of this is combined with a wealth of mathematics, statistics and machine learning expertise.
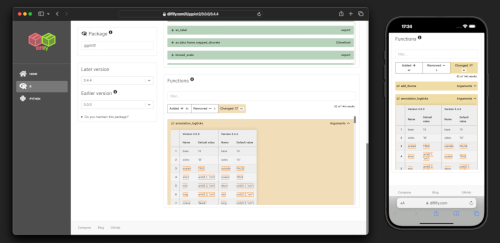
Using responsive design, we can turn your dashboards and applications from something that may only work well for someone sitting at a desk with a monitor and mouse to something that can also be used effectively on small touchscreen devices while sitting on a bus. And most scenarios in between. We can also help you bring your app to the widest possible audience by fixing many common accessibility issues.
Furthermore, from the optimal design and placement of interactive elements to implementing data-visualisation best practices, we've got it covered. By combining the science of how humans see, perceive and interpret sensory information with years of experience of designing with the front-end web stack, we can ensure you won’t have to choose between form and function.

By building template frameworks that follow best practice UI and UX techniques, we streamline your workflow, allowing you to create informative outputs at the click of a button. We also offer mentoring to your data science teams and more in-depth training on specific languages and tools.
To get started, get in touch and our representatives will get back to you to discuss your needs.
Contact us!Ready to move on from SAS, SPSS or Excel? With over 100 years of combined experience in R and Python, we can migrate your existing workflows to open-source, review your code, and set up automation and CI/CD so your team hits the ground running.
Read moreOur team brings academic and industry experience across multiple sectors to your projects, crunching data, surfacing insights and freeing you to focus on growing your business.
Read moreGet In Touch
Ready to get started?
Our representatives will get back to you to discuss your needs and find the right solution for your business.
Contact us