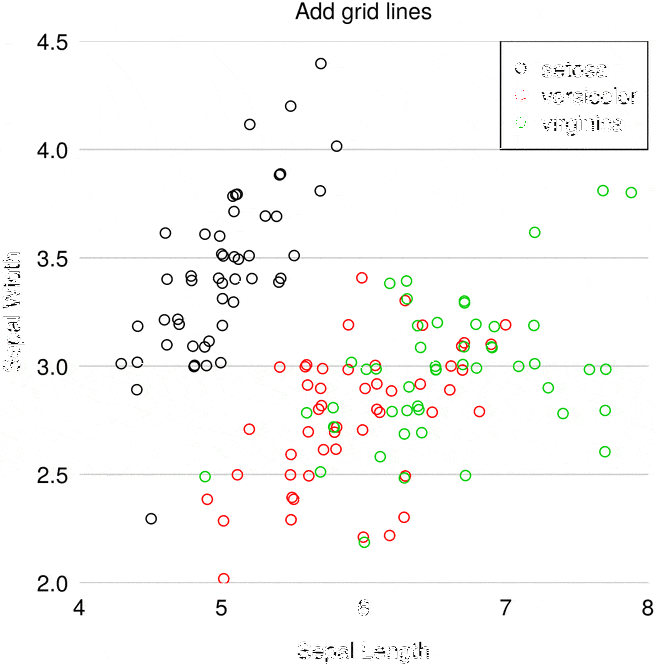
Publication quality base R graphics Fixing the problem Why not use {ggplot2} (or something else)? Publication quality base R graphics Base R graphics get a bad press (although to be fair, they could have chosen their default values better). In general, they are viewed as a throw back to the dawn of the R era. I think that most people would agree that, in general, there are better graphics techniques in R (e.
base
Recent Posts
- How to customise the style of your {shinydashboard} Shiny app
- Network Error Logging - Important Insights
- SatRdays London 2023: Speakers
- Content Security Policy - Why You Need It
- Why should I use R: The Excel R Data Wrangling comparison: Part 1
- Shiny in Production 2023: Workshops
- Work smarter; not harder: COVID-19 processing for the WHO/Europe
- Should I learn Stan?
- February Training Update
- Quarto for the Python user