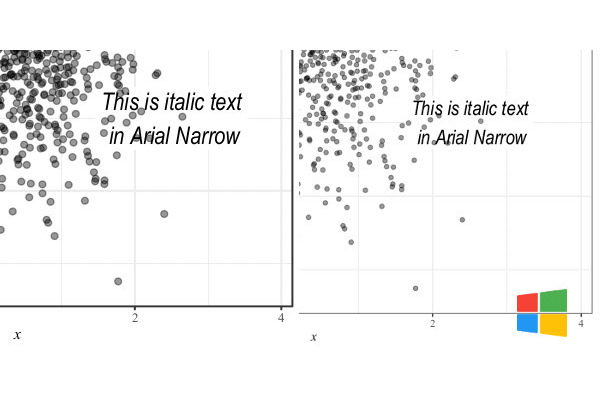
In our recent post about saving R graphics, it became obvious that achieving consistent graphics across platforms or even saving the “correct” graph on a particular OS was challenging. Getting consistent fonts across platforms often failed, and for the default PNG device under Windows, anti-aliasing was also an issue. The conclusion of the post was to use grDevices::cairo_pdf() for saving PDF graphics or grDevices::png(..., type = "cairo_png") for PNGs or alternatively the new {ragg} package.
cairo
R is known for it’s amazing graphics. Not only {ggplot2}, but also {plotly}, and the other dozens of packages at the graphics task view. There seems to be a graph for every scenario. However once you’ve created your figure, how do you export it? This post compares standard methods for exporting R plots as PNGs/PDFs across different OSs. As R has excellent cross-platform capabilities, we may expect this to follow through to exporting graphics.
Recent Posts
- Alt Text in R: Plots, Reports, and Shiny
- How to customise the style of your {shinydashboard} Shiny app
- Network Error Logging - Important Insights
- SatRdays London 2023: Speakers
- Content Security Policy - Why You Need It
- Why should I use R: The Excel R Data Wrangling comparison: Part 1
- Shiny in Production 2023: Workshops
- Work smarter; not harder: COVID-19 processing for the WHO/Europe
- Should I learn Stan?
- February Training Update