Porting a Shiny App to Observable Framework: Part 2
Published: January 30, 2025.
This post, Part 2 in a series of two, looks at styling and deploying the Observable Framework app we built in part 1.
Published: January 30, 2025.
This post, Part 2 in a series of two, looks at styling and deploying the Observable Framework app we built in part 1.
Published: January 16, 2025.
This post, Part 1 in a series of two, looks at porting the functional code of a Shiny app - written in R - into JavaScript code to be used in an Observable Framework application.
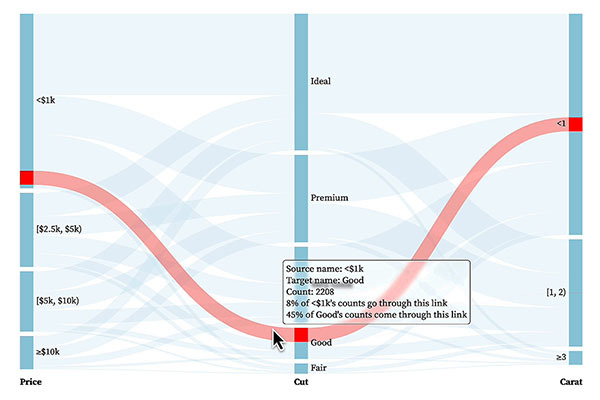
Published: March 30, 2023.
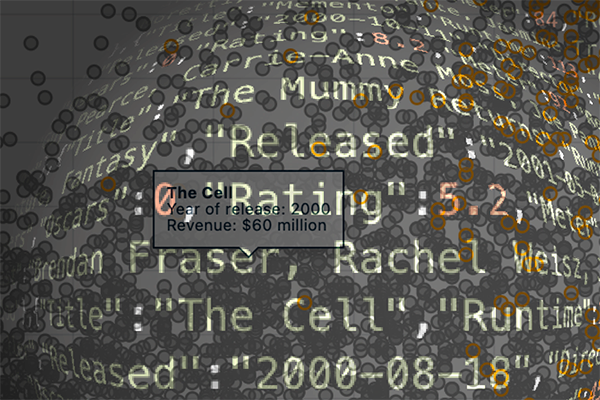
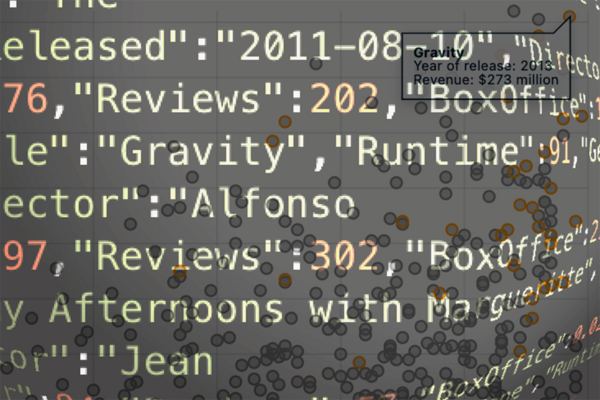
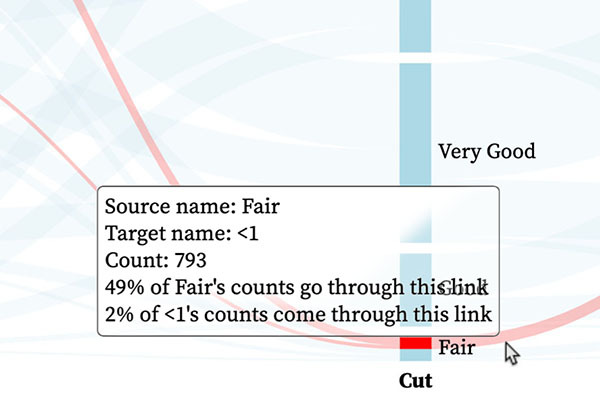
Tooltips in interactive graphics provide a means of giving the user precise details about particular features of the underlying dataset. Using some simple CSS, this post explores how tweaking the design of tooltips can improve the user's experience.
Published: January 26, 2023.
This post covers the "why?" and "how?" of making Shiny applications feel like they respond instantaneously to users' interactions.
Published: October 12, 2021.
Learning D3.js can be pretty overwhelming as an R user. Luckily, the {r2d2} package lets you keep your data cleaning steps in R and easily incorporate any visualisation in R Markdown reports and R Shiny dashboards. This tutorial-style blog will take you through creating your first D3 visualisation with a bit of Scooby-Doo along the way.