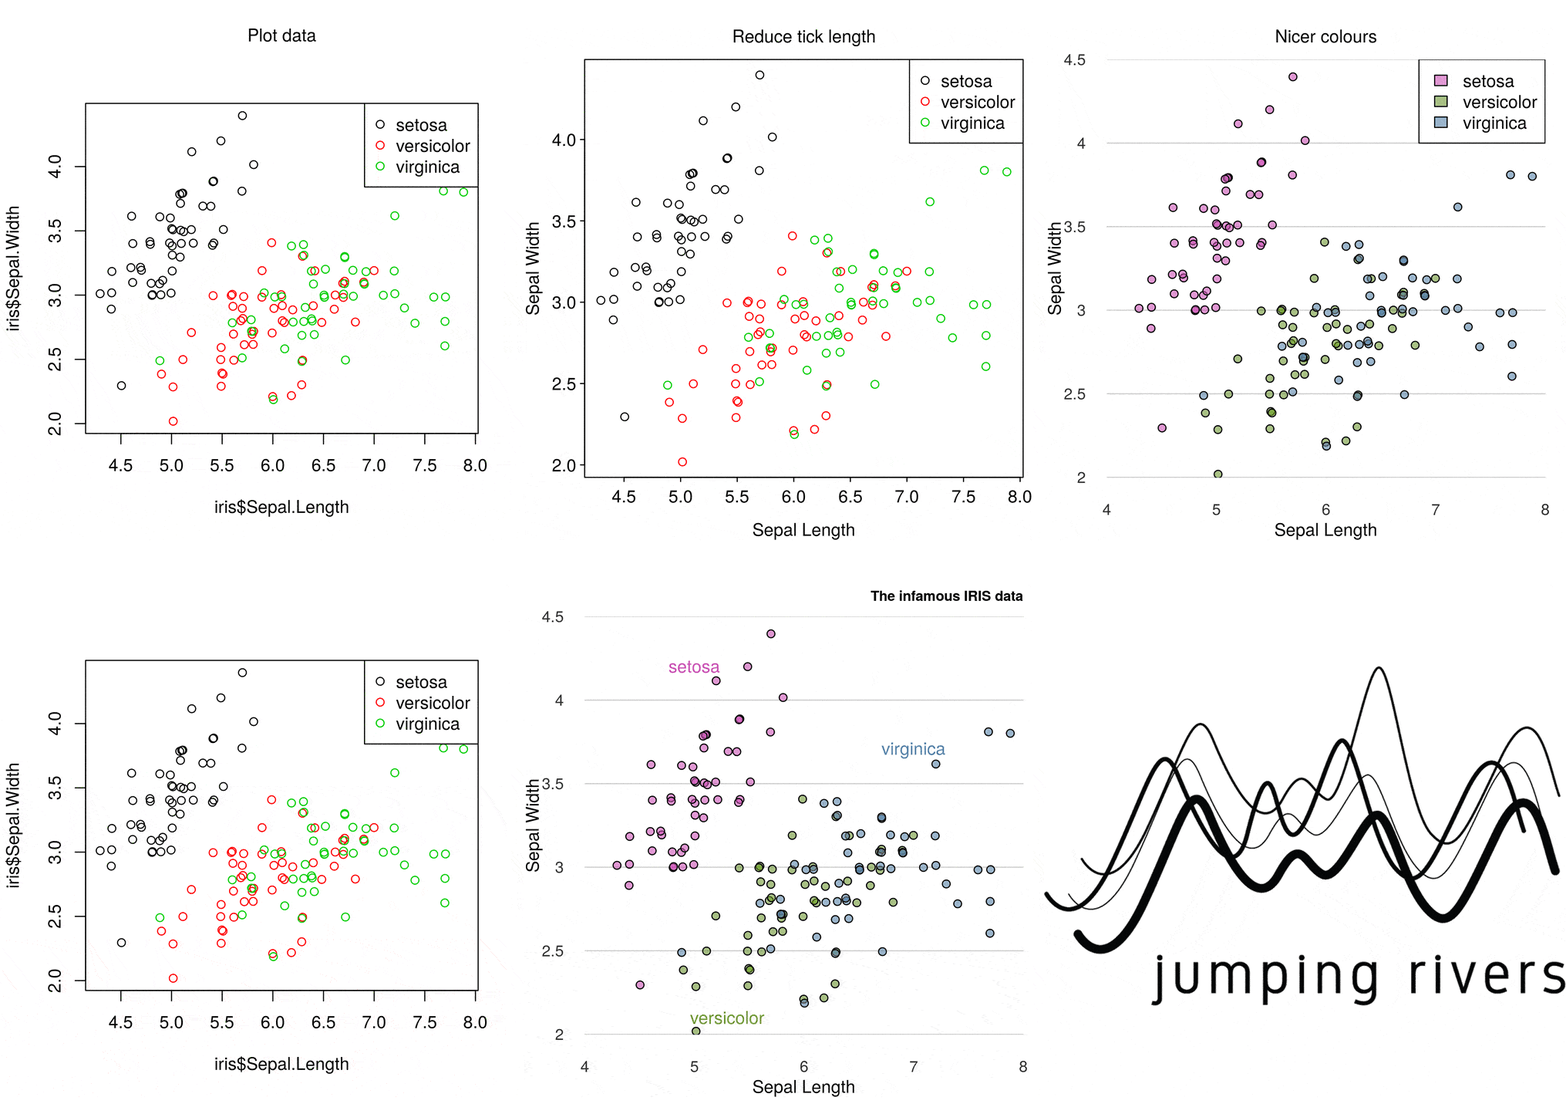
This is part three of our four part series Part 1: Specifying the correct figure dimension in {knitr}. Part 2: What image format should you use for graphics. Part 3: Including external graphics in your document (this post). Part 4: Setting default {knitr} options. In this third post, we’ll look at including eternal images, such as figures and logos in HTML documents. This is relevant for all R markdown files, including fancy things like {bookdown}, {distill} and {pkgdown}.
graphics
This is part two of our four part series Part 1: Specifying the correct figure dimension in {knitr}. Part 2: What image format should you use for graphics (this post). Part 3: Including external graphics in your document. Part 4: Setting default {knitr} options. There are (at least) three file formats to choose from: JPEG, PNG and SVG. Attribute JPEG PNG SVG Type Raster Raster Vector Transparency No Yes Yes Animation No No Yes Lossy Yes No Yes Recommended Occasionally Yes Often If you are reading this via a syndication site, be sure to go the original post for updated links.
Published: February 15, 2021
This is part one of our four part series Part 1: Specifying the correct figure dimension in {knitr} (this post). Part 2: What image format should you use for graphics. Part 3: Including external graphics in your document. Part 4: Setting default {knitr} options. At Jumping Rivers we recently moved our website from WordPress to Hugo. The main reason for the move was that since the team are all very comfortable with Git, continuous integration and continuous development using a static web-site generator made more sense than WordPress.
In our recent post about saving R graphics, it became obvious that achieving consistent graphics across platforms or even saving the “correct” graph on a particular OS was challenging. Getting consistent fonts across platforms often failed, and for the default PNG device under Windows, anti-aliasing was also an issue. The conclusion of the post was to use grDevices::cairo_pdf() for saving PDF graphics or grDevices::png(..., type = "cairo_png") for PNGs or alternatively the new {ragg} package.
R is known for it’s amazing graphics. Not only {ggplot2}, but also {plotly}, and the other dozens of packages at the graphics task view. There seems to be a graph for every scenario. However once you’ve created your figure, how do you export it? This post compares standard methods for exporting R plots as PNGs/PDFs across different OSs. As R has excellent cross-platform capabilities, we may expect this to follow through to exporting graphics.
Styling {ggplot2} graphics In our previous post, we demonstrated that contrary to popular opinion, it is possible to generate attractive looking plots using just base graphics. Although we did confess, that it did take a lot of time and effort. In this post, we repeat the same exercise. Using the dreaded iris data set, we’ll first create the default {ggplot2} graph, before applying a bit of care and attention. The standard ggplot version The standard scatter plot is straightforward to create.
Publication quality base R graphics Fixing the problem Why not use {ggplot2} (or something else)? Publication quality base R graphics Base R graphics get a bad press (although to be fair, they could have chosen their default values better). In general, they are viewed as a throw back to the dawn of the R era. I think that most people would agree that, in general, there are better graphics techniques in R (e.
The {plotly} package. A godsend for interactive documents, dashboard and presentations. For such documents, there is no doubt that anyone would prefer a plot created in {plotly} rather than {ggplot2}. Why? Using {plotly} gives you neat and crucially interactive options at the top, whereas {ggplot2} objects are static. In an app we have been developing here at Jumping Rivers, we found ourselves asking the question would it be quicker to use plot_ly() or wrapping a {ggplot2} object in ggplotly()?
Recent Posts
- Reproducible reports with Jupyter
- posit::conf(2023)
- Shiny in Production: Full speaker lineup
- Using Stan to analyse global UFO sighting reports
- Talks to watch at the RSS International Conference 2023
- Our ISO 27001 Certification
- Best Practices for Data Cleaning and Preprocessing
- SatRdays London 2023 - Recordings
- Generate multiple presentations with Quarto parameters
- Shiny in Production 2023