Customising figures in Matplotlib
Published: November 10, 2022.
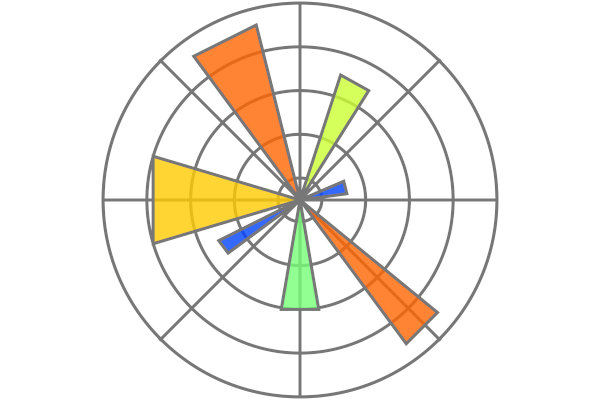
When creating graphs for a report or publication we usually want to ensure they follow a certain style. In this blog post we will look at formatting and colourmap customisation in the popular Matplotlib library.