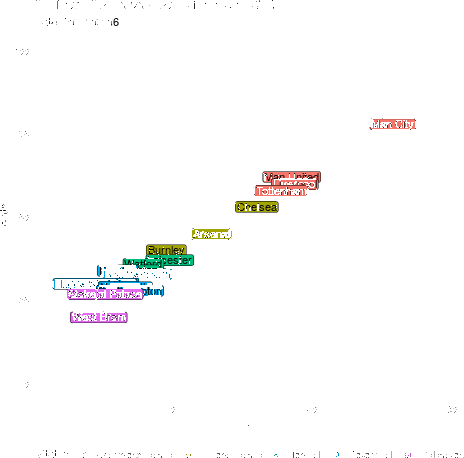
Ever wonder what an evolving gif of each premier league team’s goal difference vs points would look like made in R? Look no further! Most of this is going to be setting up the data (as always) instead of actually plotting the data. To get the data into shape, we’re going to be using the {tidyverse} and {lubridate}, which you can install the usual way via install.packages(). To animate the data we’ll be using the {gganimate} package.
premier league
Recent Posts
- Shiny in Production: Sponsors
- Reproducible reports with Jupyter
- posit::conf(2023)
- Shiny in Production: Full speaker lineup
- Using Stan to analyse global UFO sighting reports
- Talks to watch at the RSS International Conference 2023
- Our ISO 27001 Certification
- Best Practices for Data Cleaning and Preprocessing
- SatRdays London 2023 - Recordings
- Generate multiple presentations with Quarto parameters