If you’re used to coding in Python or R and want to write a web application quickly you can avoid having to learn HTML, JavaScript, etc, by using H2O Wave to write your web application with Python or R. 
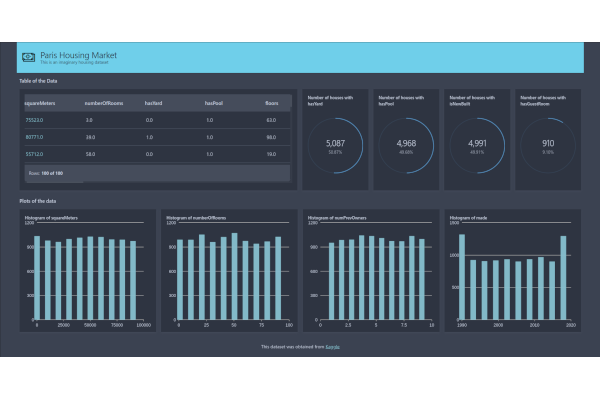
In this post we will go through an example of how to build a simple app to display data in various forms including plots, tables and graphics using Python. Before continuing with this tutorial if you have no experience with H2O Wave I would strongly suggest going through their introductory tutorials and installation guide first before you proceed.
pyblogger
Recent Posts
- Reproducible reports with Jupyter
- posit::conf(2023)
- Shiny in Production: Full speaker lineup
- Using Stan to analyse global UFO sighting reports
- Talks to watch at the RSS International Conference 2023
- Our ISO 27001 Certification
- Best Practices for Data Cleaning and Preprocessing
- SatRdays London 2023 - Recordings
- Generate multiple presentations with Quarto parameters
- Shiny in Production 2023