There’s only two weeks left to go until Shiny in Production 2023! The events team are hard at work getting things ready for the day, and we wanted to take this opportunity to say a huge thank you to our event sponsors! Gold Sponsor National Innovation Centre for Data The National Innovation Centre for Data (NICD) was created in 2019 with £30 million of funding from the government and Newcastle University.
r
Our bags are packed, flights are booked, and we’re ready to head stateside for posit::conf(2023). We’re excited to be sponsoring the event this year, as well as presenting a few talks ourselves. You’ll be able to fine Colin, Liam and Rich at the Jumping Rivers exhibition stand for the week, come along, say hello, and get your hands on one of our coveted JR coasters. Do you use Professional Posit Products?
Published: September 7, 2023
We are pleased to announce the full line-up for this year’s Shiny in Production conference! Don’t miss out on this excellent set of talks and workshops - head over to the conference website to sign up now! Workshops This year’s workshops consist of two delivered by our JR trainers, and one by a special guest, Andrie de Vries of Posit! Andrie de Vries - Posit Introduction to Shiny for Python
Published: August 31, 2023
UFO sighting data A recent #TidyTuesday data set piqued my interest. It’s a rather large collection of worldwide reportings of UFO sightings. Interesting. You can download the data yourself and load it into R: library("readr") ufo_sightings = read_csv("ufo_sightings.csv") ufo_sightings contains information about thousands of UFO sightings. Each sighting contains information such as the date and time (reported_date_time, day_part) of the sighting, the location (city, state, country) of the sighting, and other information such as a freetext summary.
The Royal Statistical Society International conference is next week from 4-7 September 2023, hosted in Harrogate. Jumping Rivers are exhibiting at the conference, as well as delivering workshops and talks. The draft program can now be viewed online, so we wanted to let you know where you can find us at the event and some of the other sessions we are looking forward to. Highlights Teaching statistics interactively with webR If you teach statistics using R and want to make your sessions more engaging, this talk is one to watch.
As data scientists, we often find ourselves immersed in a vast sea of data, trying to extract valuable insights and hidden patterns. However, before we embark on the journey of data analysis and modeling, we must first navigate the crucial steps of data cleaning and preprocessing. In this blog post, we will explore the significance of data cleaning and preprocessing in data science workflows and provide practical tips and techniques to handle missing data, outliers, and data inconsistencies effectively.
The recordings from this year’s SatRdays London conference are here! Over the next couple of weeks, we will be releasing the recordings of some of the excellent talks from the conference! You’ll be able to find them all in this playlist as they’re released, and keep an eye on our Twitter feed to see them as they come out. Data comes in all shapes and sizes. It can often be difficult to know where to start.
Parameterised reporting is a powerful technique that allows you to create dynamic and customisable reports by incorporating user-defined parameters. These parameters act as placeholders that can be easily modified to generate tailored reports based on specific inputs or conditions, enabling seamless updates to reports without the need for manual modifications. Quarto, a modern and flexible document generation tool, provides excellent support for parameterised reporting. In this blog, we will be looking at a Quarto Reveal JS presentation as an example.
Published: July 18, 2023
With the early bird deadline approaching, we thought now would be a great time to tell you a bit more about what to expect at this year’s Shiny in Production! Do you require help building a Shiny app? Would you like someone to take over the maintenance burden? If so, check out our Shiny and Dash services. As with last year’s conference, SIP2023 will take place over a day and a half at the Catalyst in Newcastle upon Tyne, UK.
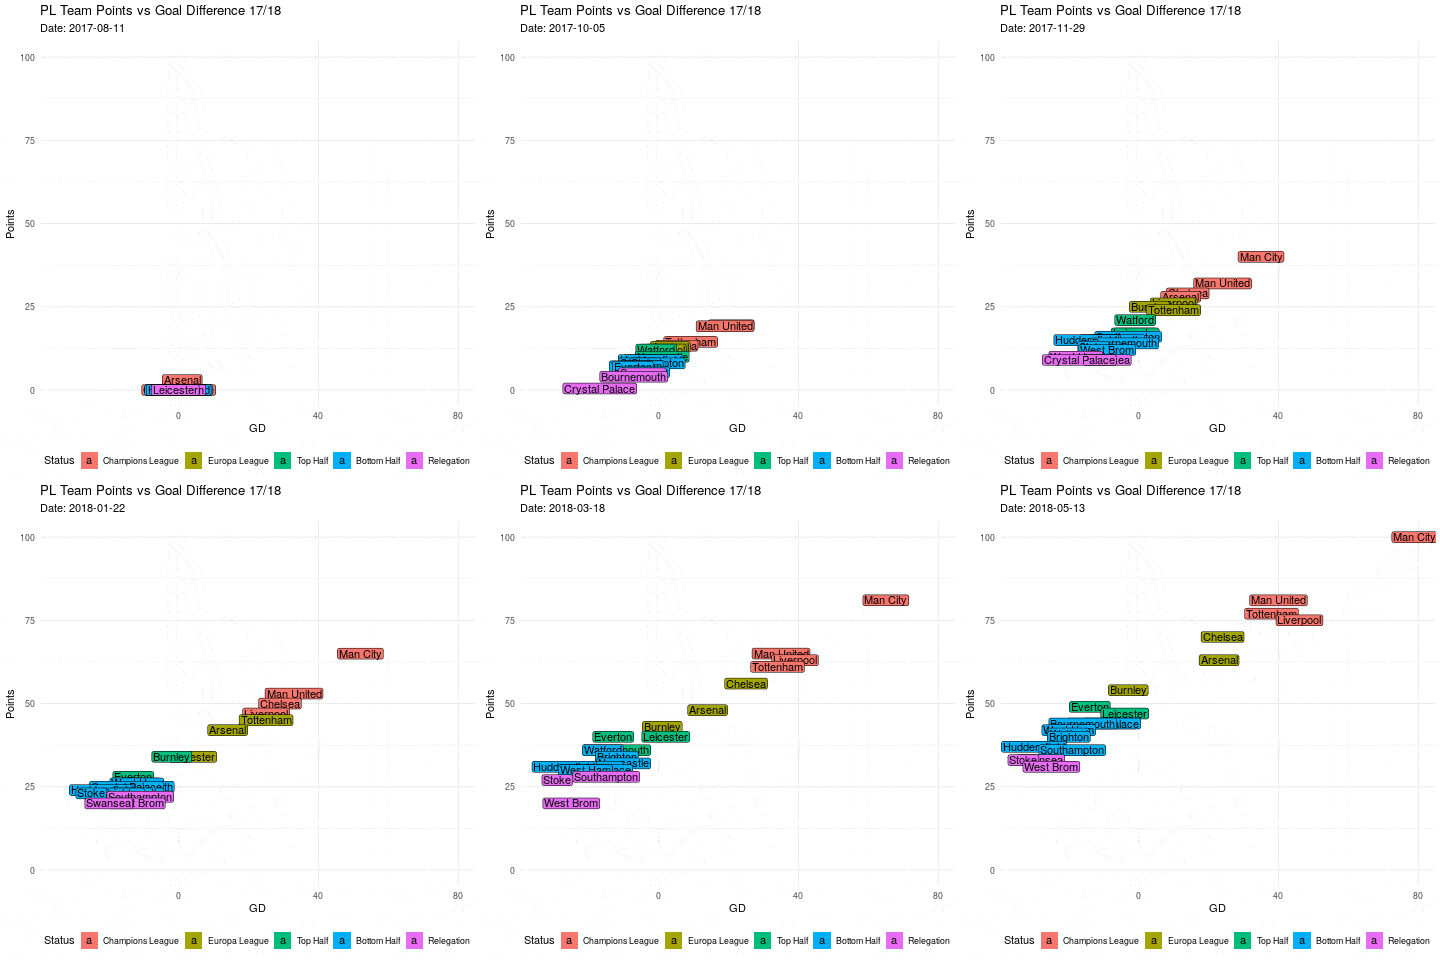
Earlier this year, two data scientists from Jumping Rivers ran an outreach activity for 14-19 year olds across the UK, in collaboration with the youth charity Speakers for Schools. The three hour workshop focussed on how to create visualisations that are both visually appealing and useful to the viewer. We demonstrated with a few examples of some visualisations that we created from some questions we asked on sign up (their favourite fast food restaurants and snacks) and showed them some examples of visualisations that challenged the view of data visualisation all being bar charts and scatter plots - think football pundit analysis and tube maps!
Recent Posts
- Shiny in Production: Sponsors
- Reproducible reports with Jupyter
- posit::conf(2023)
- Shiny in Production: Full speaker lineup
- Using Stan to analyse global UFO sighting reports
- Talks to watch at the RSS International Conference 2023
- Our ISO 27001 Certification
- Best Practices for Data Cleaning and Preprocessing
- SatRdays London 2023 - Recordings
- Generate multiple presentations with Quarto parameters