A timeline of R's first 30 years
Published: June 27, 2024.
R has come a long way since it's initial public release in August 1993. Explore some highlights of the last thirty years in an interactive timeline.
Published: June 27, 2024.
R has come a long way since it's initial public release in August 1993. Explore some highlights of the last thirty years in an interactive timeline.
Published: October 22, 2021.
Our annual training review is back! Like many other training providers, we had to pivot to online learning in 2020, which brought with it challenges but also new opportunities. The review will show you what the year looked like for our trainers and training course attendees, including which trainer taught the most courses!
Published: October 13, 2020.
Don’t we all miss 2019 (blame Covid for the long delay in this post). The days of going to work and seeing your work colleagues face to face - and for some of you, attending one of our on-site training courses! 2019 was a great year for us.

Published: June 25, 2020.
Continuous integration is an amazing tool when developing R packages. We push a change to the server, and a process is spawned that checks we haven’t done something silly. It protects us from ourselves! However this process can become slow, as typically the CI process starts with a blank virtual machine (VM).

Published: December 5, 2019.
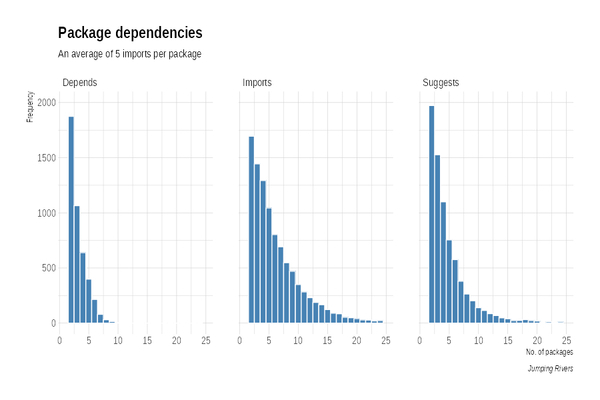
Before we start anything, I’d like to mention that most of the hard work came from nsaunders and his great blog post Idle thoughts lead to R internals: how to count function arguments. Let’s get started. The aim of this blog is to capture the number of arguments present in each function with packages of the {tidyverse}.
Published: August 16, 2019.
Big news. RStudio recently started certifying trainers in three areas: the tidyverse, Shiny and teaching. To be certified to teach a topic you have to pass the exam for that topic and the teaching exam. Even bigger news. Four of your lovely Jumping Rivers trainers are now certified to teach at least one topic!
Published: May 21, 2019.
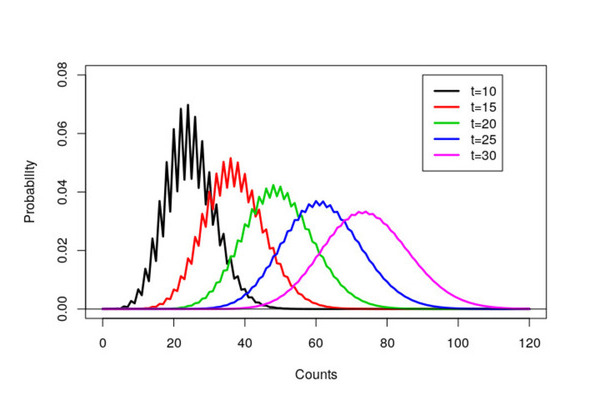
This blog post has two goals. Investigate the {bench} package for timing R functions. Consequently explore the different algorithms in the {digest} package using {bench}. What Is {Digest}? The {digest} package provides a hash function to summarise R objects.

Published: November 1, 2018.
At Jumping Rivers we run a lot of R courses. Some of our most popular courses revolve around the tidyverse, in particular, our Introduction to the tidyverse and our more advanced mastering course. We even trained over 200 data scientists NHS - see our case study for more details.
Published: September 20, 2018.
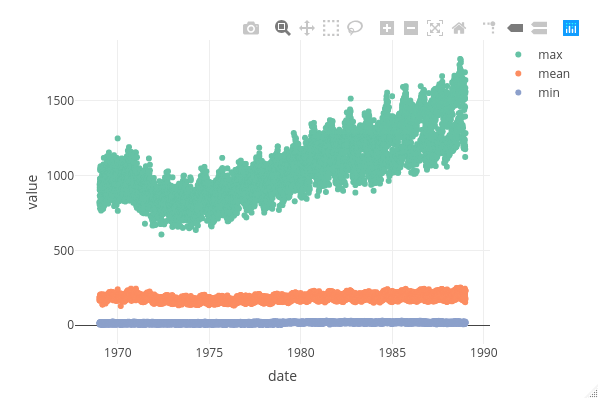
Last week I spent some time reminiscing about my PhD and looking through some old R code. This trip down memory lane led to some of my old R scripts that amazingly still run. My R scripts were fairly simple and just created a few graphs.
Published: September 2, 2018.
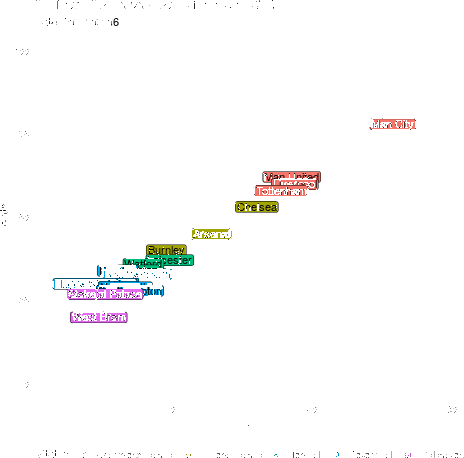
Ever wonder what an evolving gif of each premier league team’s goal difference vs points would look like made in R? Look no further! Most of this is going to be setting up the data (as always) instead of actually plotting the data.
Published: May 9, 2018.
Big news, from the 13th till the 27th June Jumping Rivers will be running 6 courses on R in Hamburg!!. It should be noted that each course runs for one day, apart from the Predictive Analytics course, which runs for 2 days. The courses are as follows:

Published: April 20, 2018.
The results of the eRum competition are in! Before we announce the winners we would like to thank everyone who entered. It has been a pleasure to look at all of the ideas on show. The Main Competition. The winner of the main competition is Lukasz Janiszewski.

Published: March 28, 2018.
Given that I do quite like twitter, I thought it would be a good idea to right about R’s interface to the twitter API; {rtweet}. As usual, we can grab the package in the usual way. We’re also going to need the {tidyverse} for the analysis, {rvest} for some initial webscraping of twitter names, {lubridate} for some date manipulation and {stringr} for some minor text mining.

Published: February 1, 2018.
Hi all, so given our logo here at Jumping Rivers is a set of lines designed to look like a Gaussian Process, we thought it would be a neat idea to recreate this image in R. To do so we’re going to need a couple packages. We do the usual install.packages() dance (remember this step can be performed in parallel).
Published: January 8, 2018.
Let’s get something straight, there isn’t really any trouble with tibbles. I’m hoping you’ve noticed this is a play on 1967 Star Trek episode, “The Trouble with Tribbles”. I’ve recently got myself a job as a Data Scientist, here, at Jumping Rivers. Having never come across tibbles until this point, I now find myself using them in nearly every R script I compose.
Published: November 27, 2017.
The {plotly} package. A godsend for interactive documents, dashboard and presentations. For such documents, there is no doubt that anyone would prefer a plot created in {plotly} rather than {ggplot2}. Why? Using {plotly} gives you neat and crucially interactive options at the top, whereas {ggplot2} objects are static.
Published: November 15, 2017.
Can’t Be Bothered Reading, Tell Me Now. A simple one line tweak can significantly speed up package installation and updates. The Wonder Of CRAN: One of the best features of R is CRAN. When a package is submitted to CRAN, not only is it checked under three versions of R